Link: Data visualization
It’s also called box-and-whisker plot. Whisker means the line.
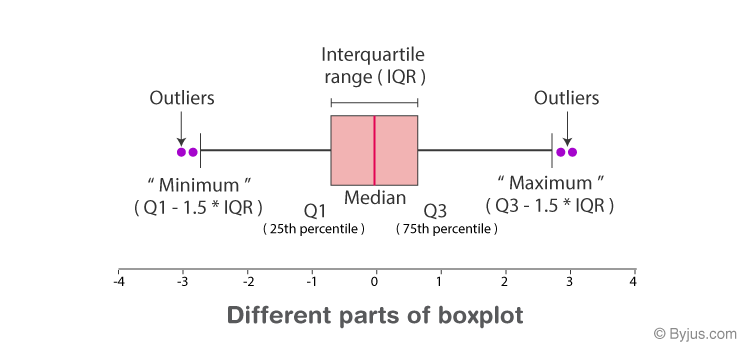
About the percentile, see Quantiles and percentiles for more details.
Error bars
Error bars are the short bars that used to indicate the error or uncertainty.
Three common types
- Standard deviation
- The most common type
- They tells how the data is distributed around the mean
- It usually shows on the graph because it shows the data straightaway
- Standard error
- They tells how the means is distributed
- Confidence intervals
- They are related to standard error