Link: Linear regresssion
The main idea
- Divide the data into smaller chunks/windows
- For each chunk, use Fitting a line to data in linear regression to find a line to fit the data
In this way, the final curve is like the combination of many pieces of line.
Steps
- Divide data into small window, for point x, we take n points that are close to x
- For the first focal point, use Weighted least squares to find the best fitted line for this window. Take note of the first point of the fitted line as the first starting point for the curve
- For the 2nd focal point, do the same. Note that the window would be same as the 1st focal point, because the n points that are closer to 2nd point are the same points. Take note of the second point of this fitted line.
- Repeated the processes for all data points
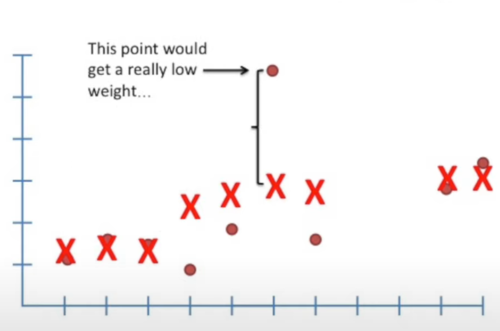
- To reduce the influence from outliers, we create an additional weight for each data points in the weighted least squares. The weight is calculated based on the y distance between the original y and the new focal point of each data. The more distance it has, the lower the weight is, because a long distance represents an outlier.
- Now we have two sets of weighting systems, one from the x distance in small chunks, one from the y distance. From here, we get a new smoother curve. Note the formula of weighting just works and no one knows why.
Other consideration
Line or parabola (curve)?
It depends. We need to look at the original data and determine which is better.
In R, lowess() only fit a line, while loess() will fit a line or a parabola, with parabola be the default, and it also draw confidence intervals around the curve (the area around the parabola).
Window size
The window size depends on us. The example uses 5 points in each window, but in reality, we usually indicate the proportion of the total instead of a specific number.