Link: Probability distribution
What is normal distribution?
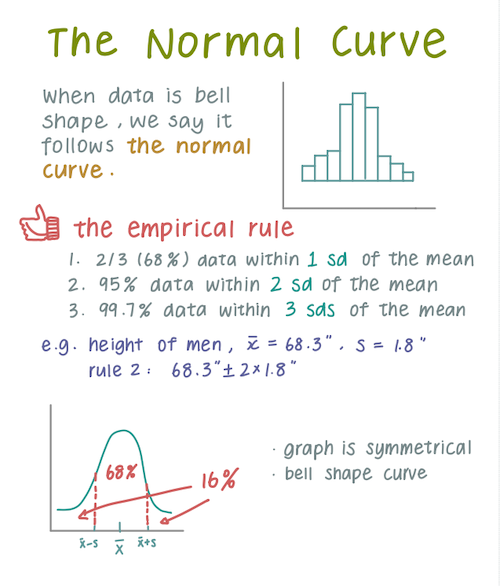
A bell shape curve. Also called Gaussian distribution or normal curve.
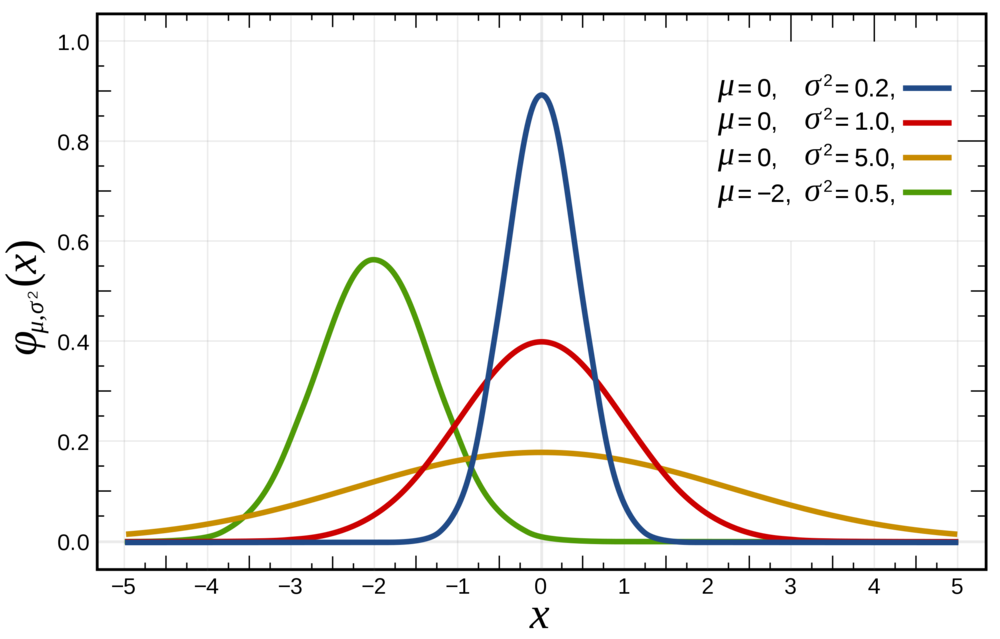
We need to know standard deviation and mean to draw the curve. They are the two parameters of the curve.
Mean μ
It determines the location of the normal distribution’s mean. Smaller μ = move towards left, bigger μ = to the right.
Standard deviation σ
Standard deviation in normal distribution is the width of the curve. The smaller standard deviation = narrower and taller curve.
The empirical rule
- 2/3 (68%) data within 1 sd of the mean
- 95% data within 2 sd of the mean
- 99.7% data within 3 sd
Usage of normal distribution
Lots of scenarios follows normal distribution. The reason is Central limit theorem.
Maximum likelihood in normal distribution
The idea and goal
The idea of Maximum likelihood in normal distribution is that, for the three factors x, μ and σ, once we fix two factors, we can change another one and plot a chart of likelihood. From the likelihood plot, the peak would be Maximum likelihood, or the point when the slope of cure = 0.
The goal is to find the maximum likelihood estimates for μ and σ.
E.g. By fixing x, and treat σ as a constant, we can get the likelihood estimate for μ.
Example: when there’s only one data point x
The likelihood of the curve with μ=28, σ=2 is 0.03, given when x = 28. The likelihood result is also the y-axis value on the normal curve.
Therefore, by repeating this process, we can plot the likelihood and find the Maximum likelihood. This is done by finding each parameter individually while treating another parameter as a constant:
- Fix σ and x (data), plot with y axis = likelihood and x axis = μ to find the optimal value for μ
- Then we can fix μ and x, to find the optimal σ.
Example: when there’re multiple data points:
Because those data points are independent events, we just need to multiply the individual likelihoods. The likelihood of the curve with μ=28, σ=2 is 0.03, given when x1 = 32 and x2 = 34.
The math
For two datasets, it looks like this:
From math perspective, to find the maximum likelihood when the slope =0, is to find where the derivative =0.
To achieve that:
-
Take the
log(likelihood), for it’s easier, and the location of the peak for μ and σ are the same -
Refer to this video for detailed math steps
-
Extend to n data points (the log-likelihood function)
-
More math with derivative (it’s the slope function log(likelihood curve)) we get the derivative of the log-likelihood cuntion. At last, we have the simplified *the derivative of the log-likelihood function with respect of μ:
The same thing apply to σ:
-
Set the derivative function = 0, and solve for μ. After math, we get the estimate for μ is actually the mean of the measurement.
-
Do the same for σ, and we get σ is the SD of the measurement.
TL;DR
- The mean of data = maximum likelihood estimates of μ (determine where the centre is)
- the sd of data = maximum likelihood estimates of σ (determine how wide)