Link: Covariance
The relationship between variables
If the data is close to the trend line, we can say the relationship is strong. If it’s the opposite, we can say the relationship is weak. These are educated guesses based on the trend.
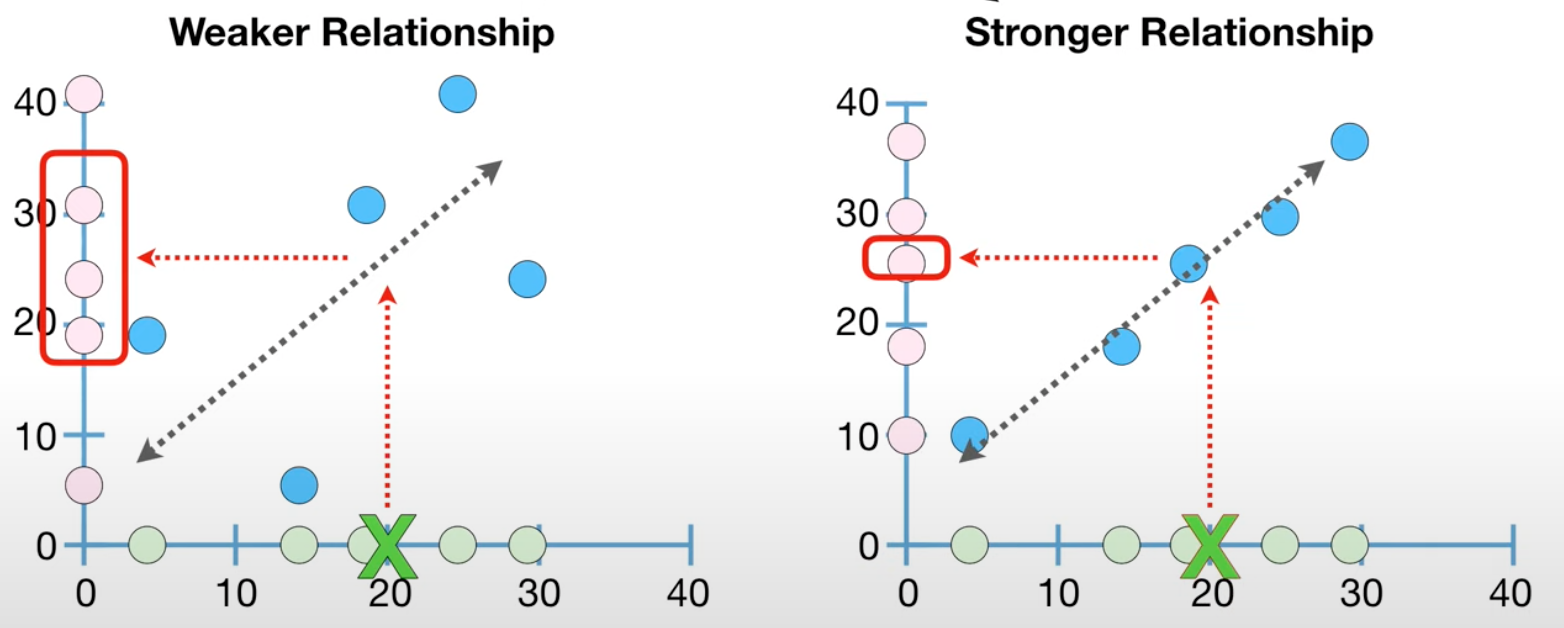
Correlation value
Weak relationship has a small correlation value, while strong relationship has a large correlation value.
The max absolute correlation value = 1, when every data point is on the line. It can happen when the slope is steep or mild.
Note: because any two dots can draw a straight line, we should not have much confidence to a correlation value = 1 when there are only two points.
Positive, negative and zero correlation value
Similar to covariance value, a negative correlation value suggests a negative trend.
The worse the fit, the closer to 0. When there’s no relationship, it will be a straight line and correlation = 0.
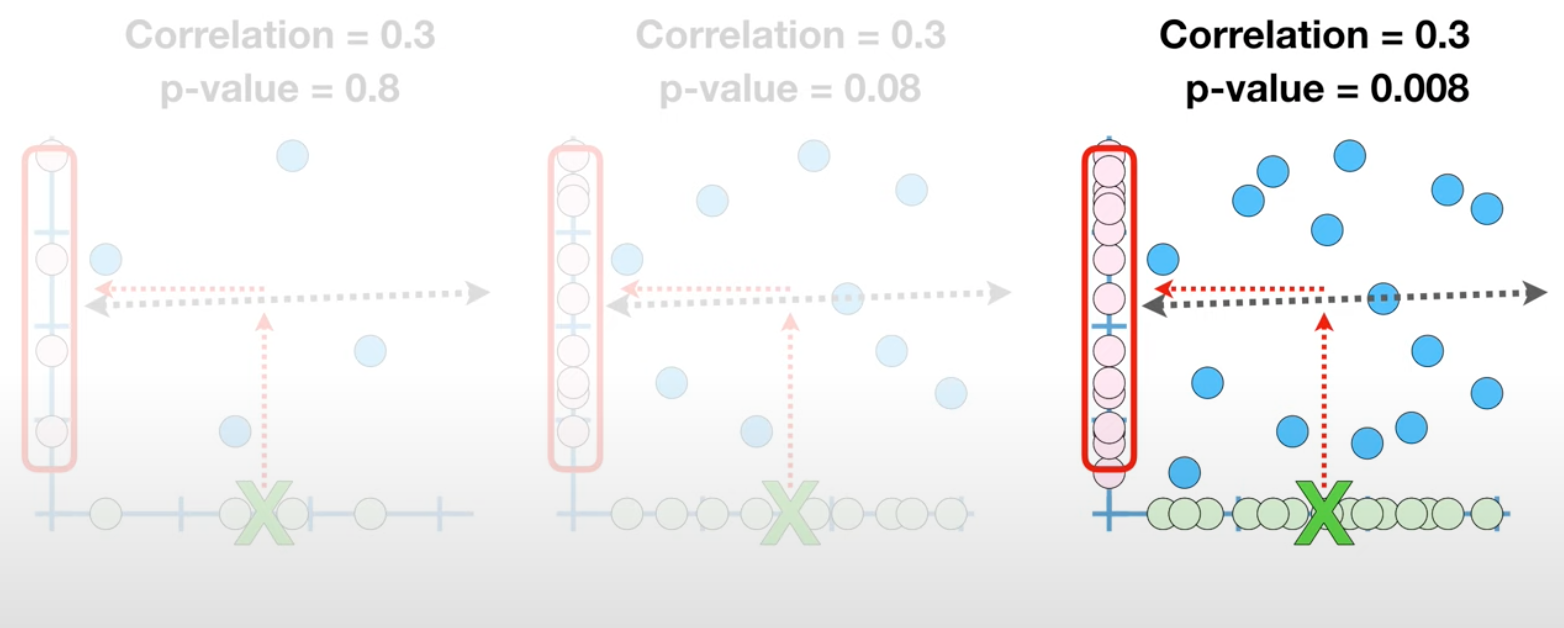
The connection between p-value and correlation
For correlation, a P-value tells us the probability that randomly drawn dots will result in a similar strong relationship. The smaller it is, the more confidence we have in the predictions (because it’s less likely to have the coincidence that the data randomly fits the line).
Educated guesses from correlation
Even we have lots of data points and a small p-value (more confidence), if the correlation value is small, the guesses would be less accurate.
Calculate correlation
The estimates:
Correlation vs R-squared
Correlation is still not easy to interpret, and R squared can help us understand.