Link: Pearson Correlation
What is the regular R?
It is the correlation values between -1 to 1 to tell how strong they are related.
What is R-squared?
Also called Coefficient of Determination. is the percentage of variation explained by the relationship between two variables.
It’s similar to R with easier interpretation.
- Like the name suggested, it’s the square of R!
- Easy to compare, e.g. is twice as good as
- Easy to calculate
- It’s a number/percentage between 0 and 1
Calculate R-squared
RSS = sum of squared residuals
TSS = total sum of squares
Usage of R-squared
We can use R-squred to quantify the difference between the model line and the mean line.
The intuition of R-squared
The numerator is the variation in x explained by y
The denominator is the variation in x without taking y into account.
Therefore, R-squared can be viewed as once we take y into account, there’s xx% reduction in variation, or, xx% variation comes from y.
Example: size/weight in mouse
Check sum of squared residuals for more details.
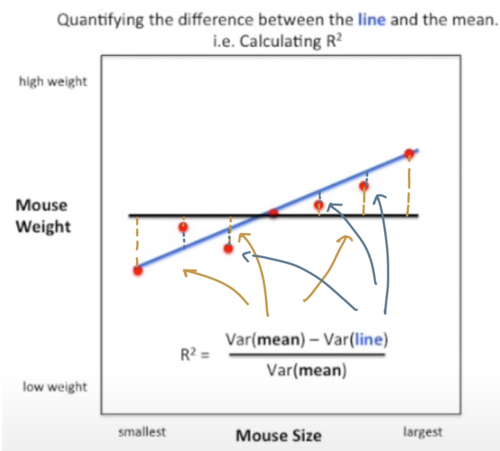
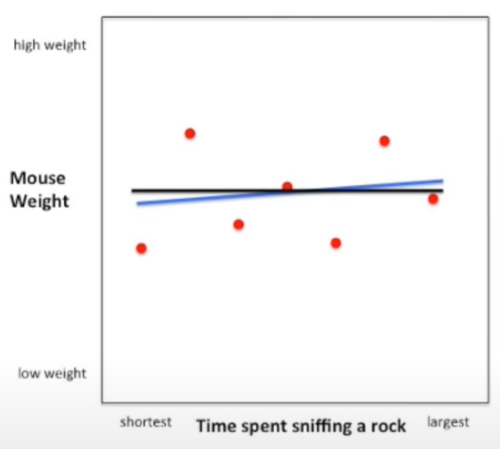
The blue line is the model line, while the black line is the mean (a constant). Apparently the model line fits better, but how much? We can use R-squared to quantify.
In this example, , meaning there’s 81% less variation around the model line than the mean, or most variation (81%) comes from the size/weight relationship.
When is smaller e.g. 6%, it indicates only small portion of variation can be explained by the relationship, aka weak correlation. It looks like below: