Link: Stats
Use to compare the means of two groups.
The goal of t-test is to compare means and see if they’re significantly different from each other.
Main concept
The two concepts from Linear regresssion can also be applied to t-test.
- Is the x variable useful to predict the y? (via R-squared)
- What’s the chance to see that relationship? (via P-value)
Steps of conducting t-test comparing with linear regression
Review t-test: it compares means from two groups and check whether they’re significantly different.
Note: the images below are comparing linear regression (left) and t-test (right) to show how different they are.
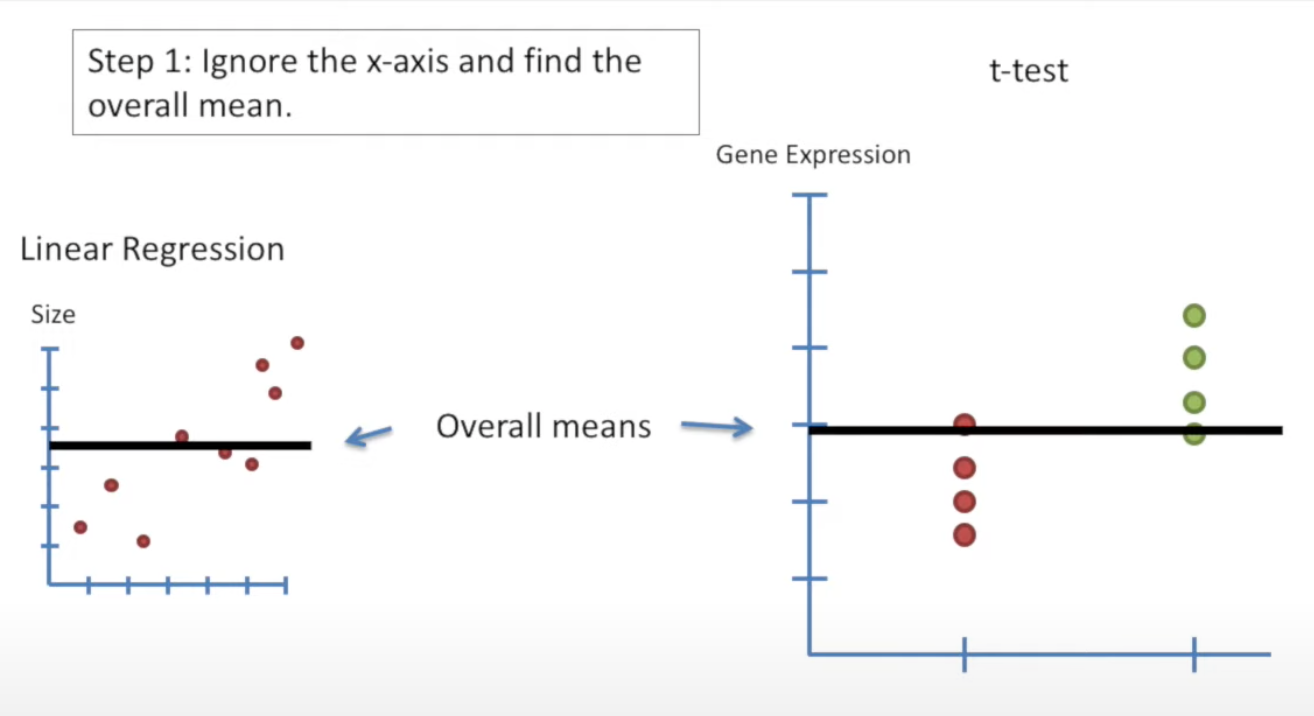
Step 1: Find overall mean
Find the overall means of linear regression and t-test.
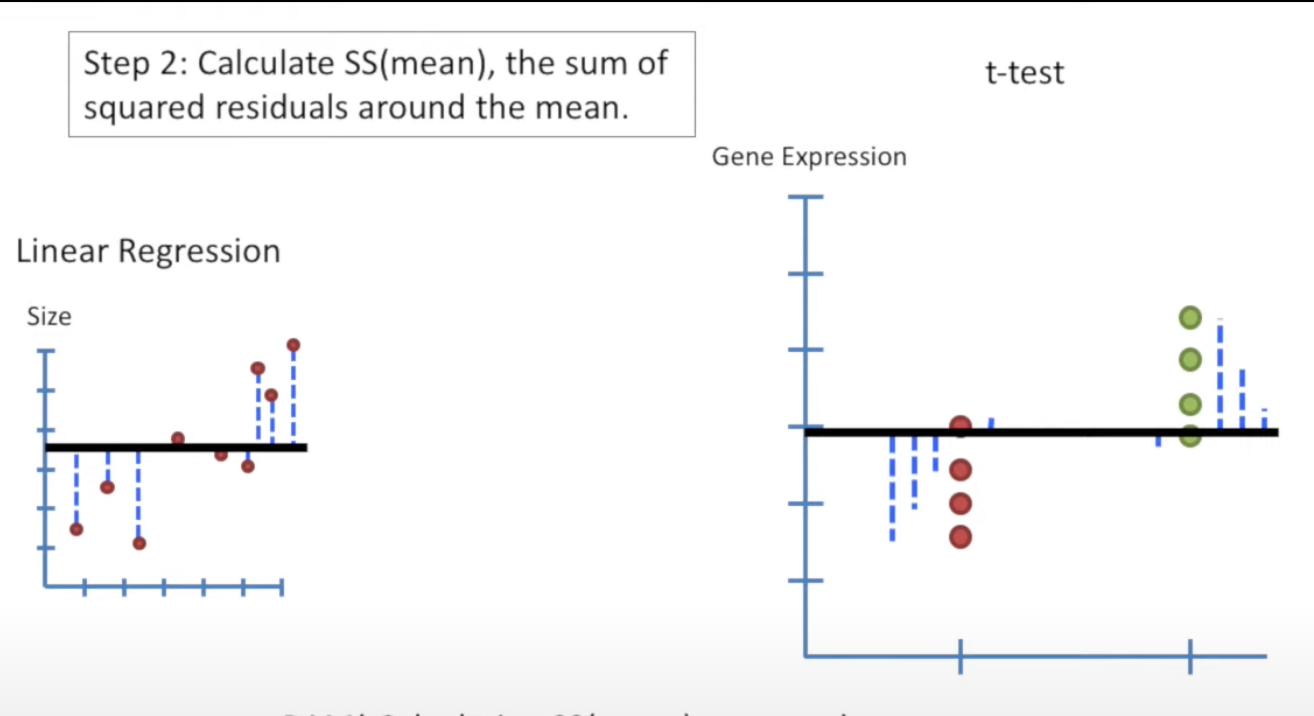
Step 2: Calculate SS(mean)
SS(mean) = sum of squared residuals around the mean.
Step 3: Fit a line to the data
Now we put x-axis back. To Fitting a line to data in linear regression, we can use Least squares.
For t-test, if we also use least squares, the line would be the two mean lines of each group. Then we can combine the two lines into a single equation by computer.
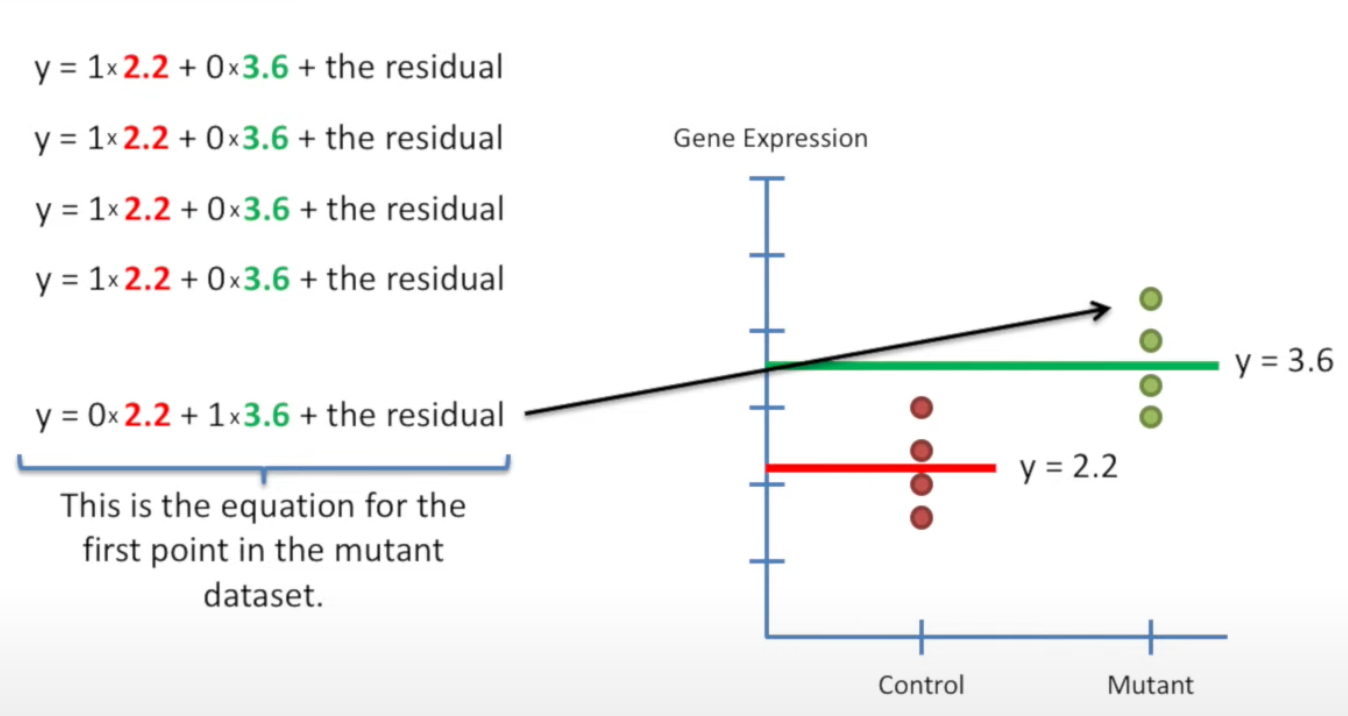
Get the equation by combine two means line
For group 1, apply y = 1 * mean1 + 0 * mean2 + the residual for each data point.
Do the same for group 2, but swap the 1 and 0 in the equation.
 The 1s and 0s forms a Design matrix, which can be combined to:
(Note that it’s not a standard design matrix)
The 1s and 0s forms a Design matrix, which can be combined to:
(Note that it’s not a standard design matrix)
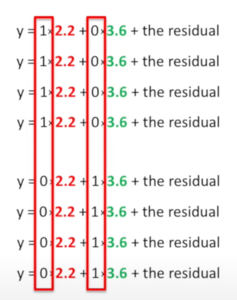
where the column1 and column2 act as a switch to turn the mean on or off.
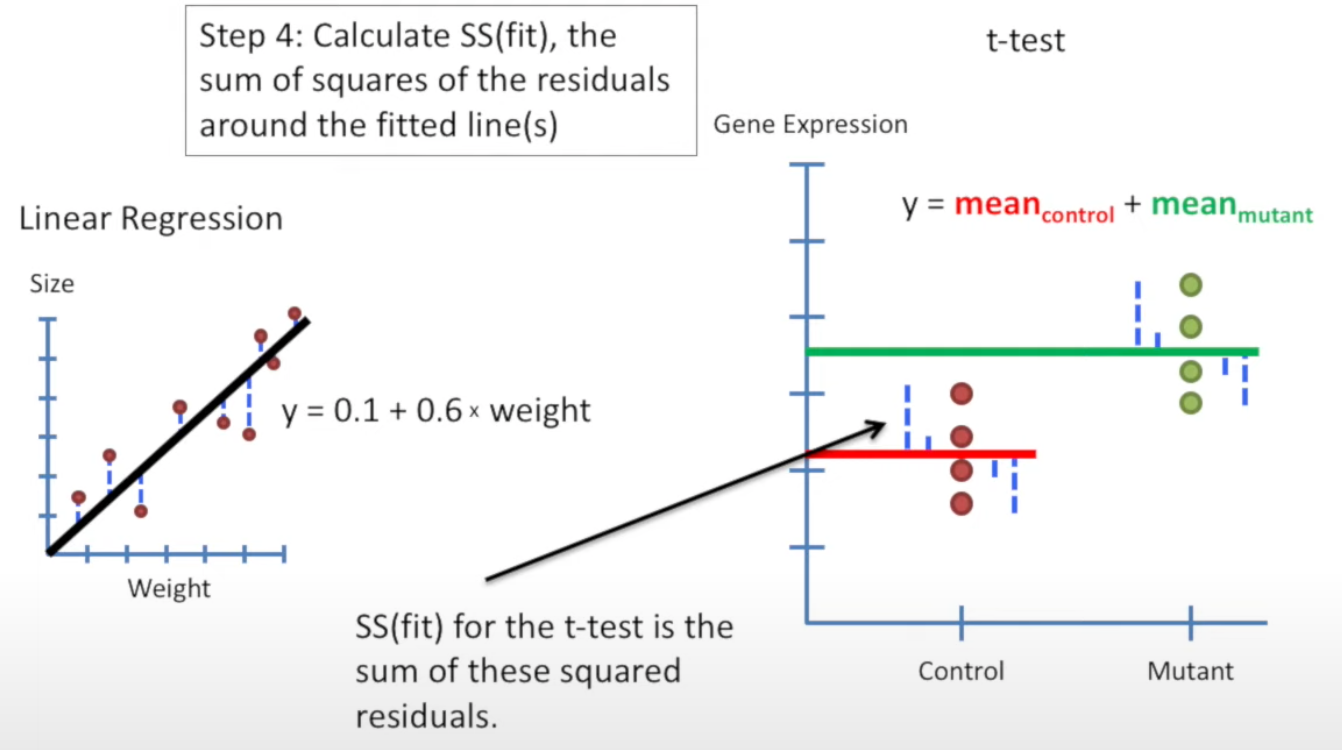
Step 4: Calculate SS(fit)
SS(fit) = ss of the residuals around the line(s)
For linear regression: SS(fit) is simple as it only has one line
SS(fit) for t-test is the ss for two lines.
Step 5: Calculate F-value
Plug-in the number from previous steps, and we have F-value.
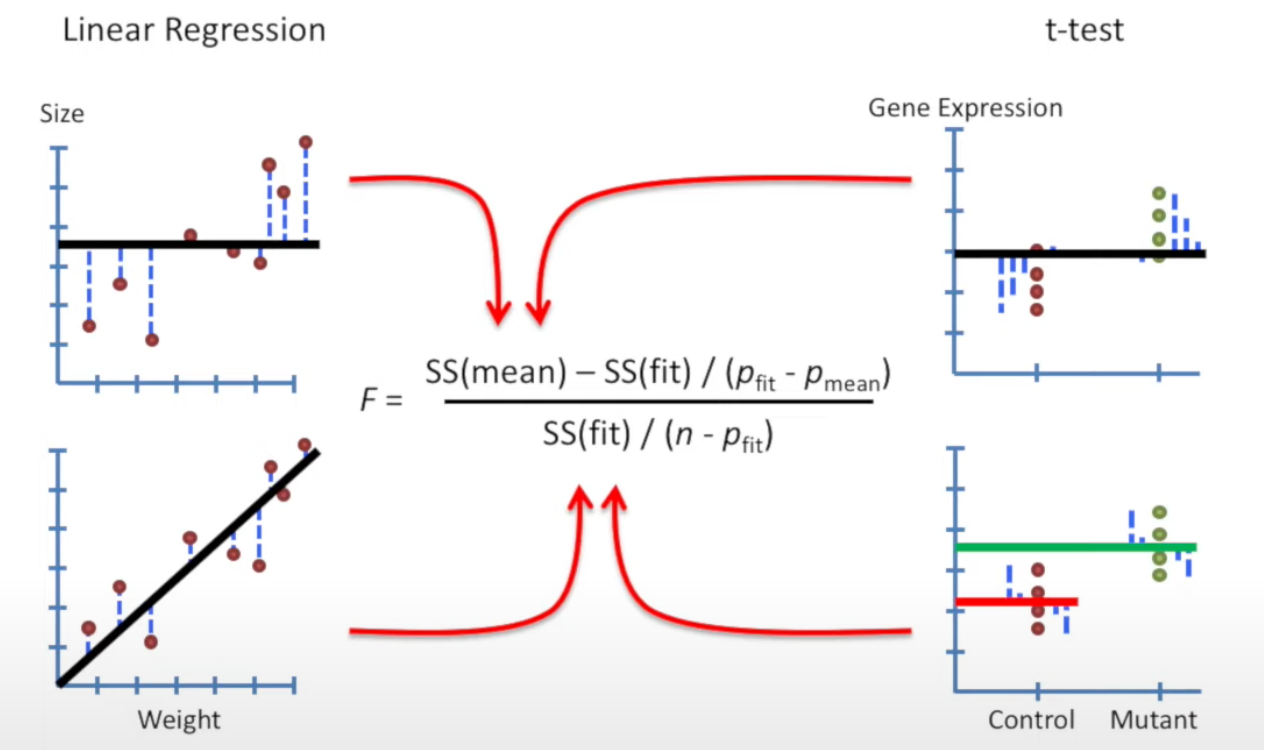
Note in here:
For linear regression, = 1, = 2
For t-test, = 1, = 2 (mean for two groups separately)
Once we have the F-value, we can convert it to p-value.