Link:
Standard design matrix
In the example in t-test, it’s not standard design matrix.
In reality, the common, standard design matrix looks like this:
 Which can be combined to below equation:
When we plug-in for F-value, it would be same as the previous method. However, this is a common practice to use standard design matrix.
How design matrix is defined in linear regression
For Linear regresssion e.g. , the design matrix could be:
| a | b |
|---|---|
| a1 | b1 |
| a2 | b2 |
| a3 | b3 |
| … | … |
Where we can put any number in the design matrix.
Design matrix and t-test in regresssion
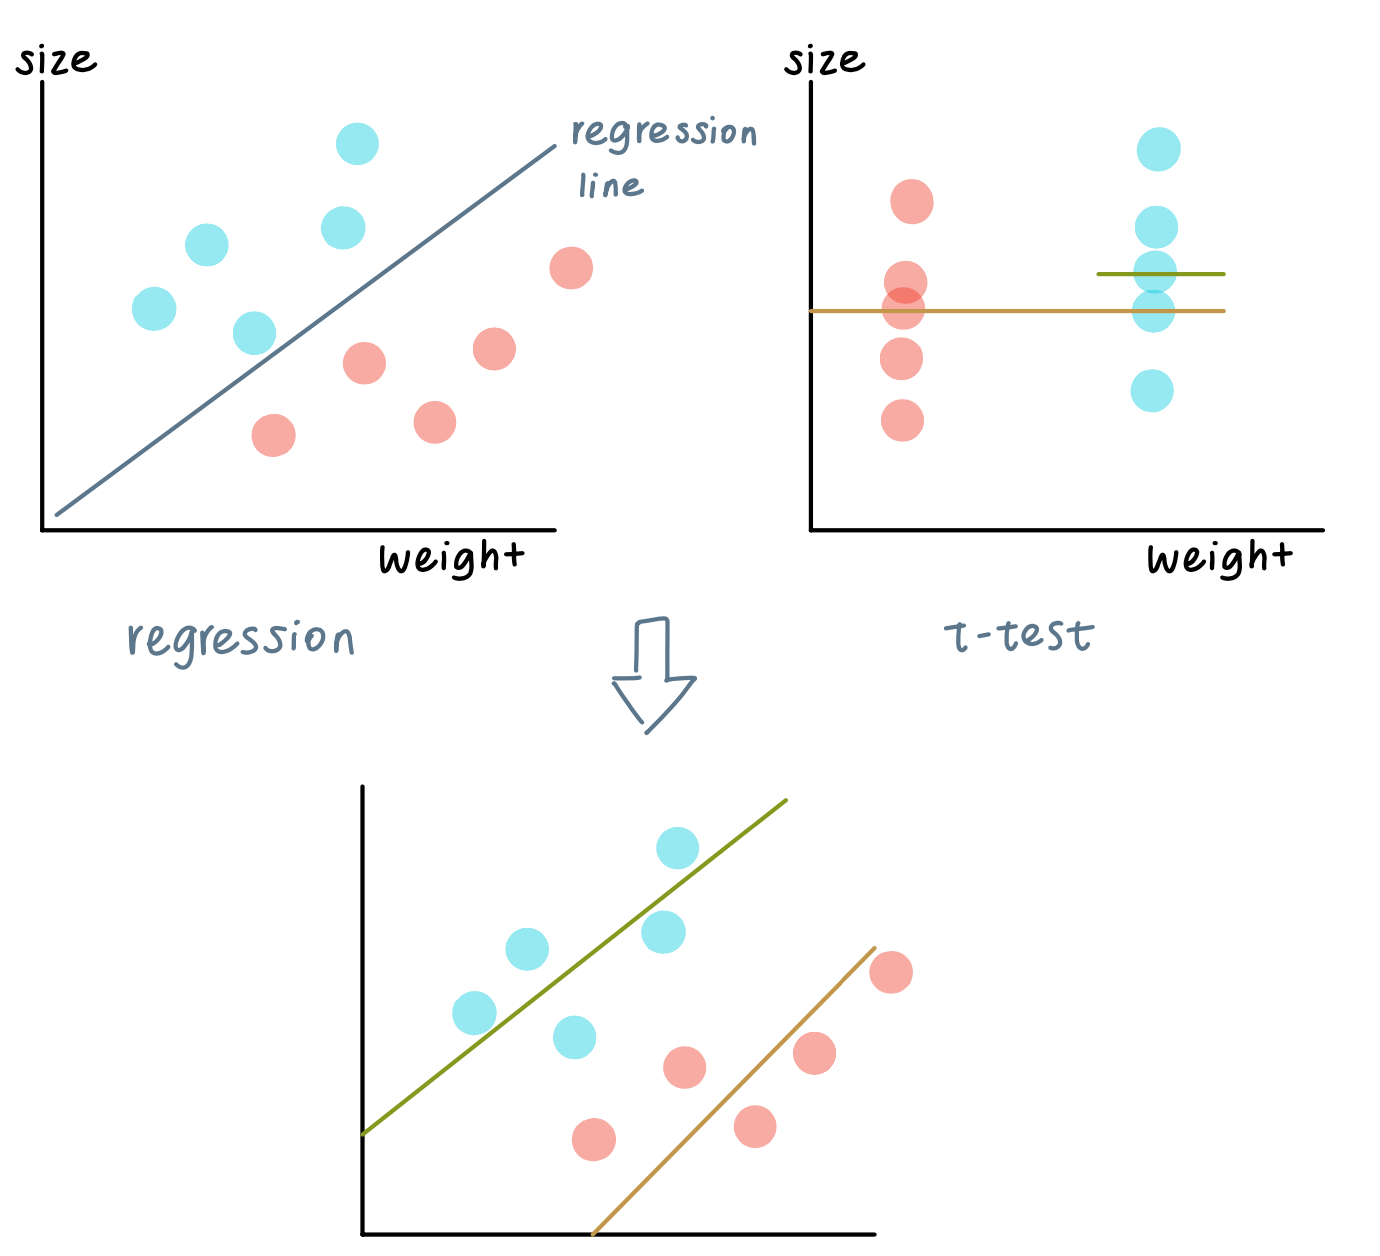
The limitation of regression: it only shows the relationship between x and y
The limit of t-test: it only compares two groups but lose the connection between x and y
By combining regression and t-test, we can design a facanier model with design matrix.
Note: red is control group, green/blue is the mutant group.
Design matrix breakdown
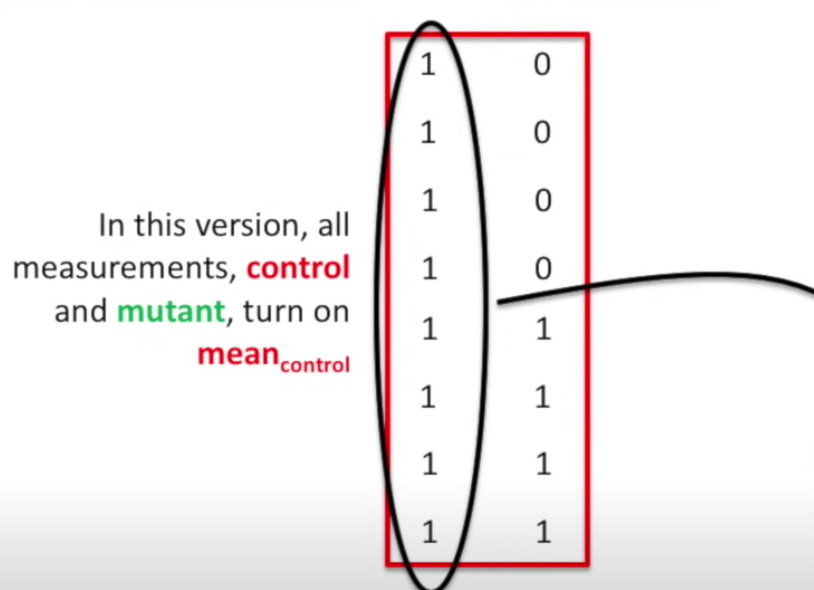
- The 1st col: all 1’s so that both lines has the y-intercept
- The 2nd col: consists with 0s and 1s, meaning whether the mutant offset is on or off. The control group is 0, and the mutant group is 1.
- The 3rd col: is the value of x.
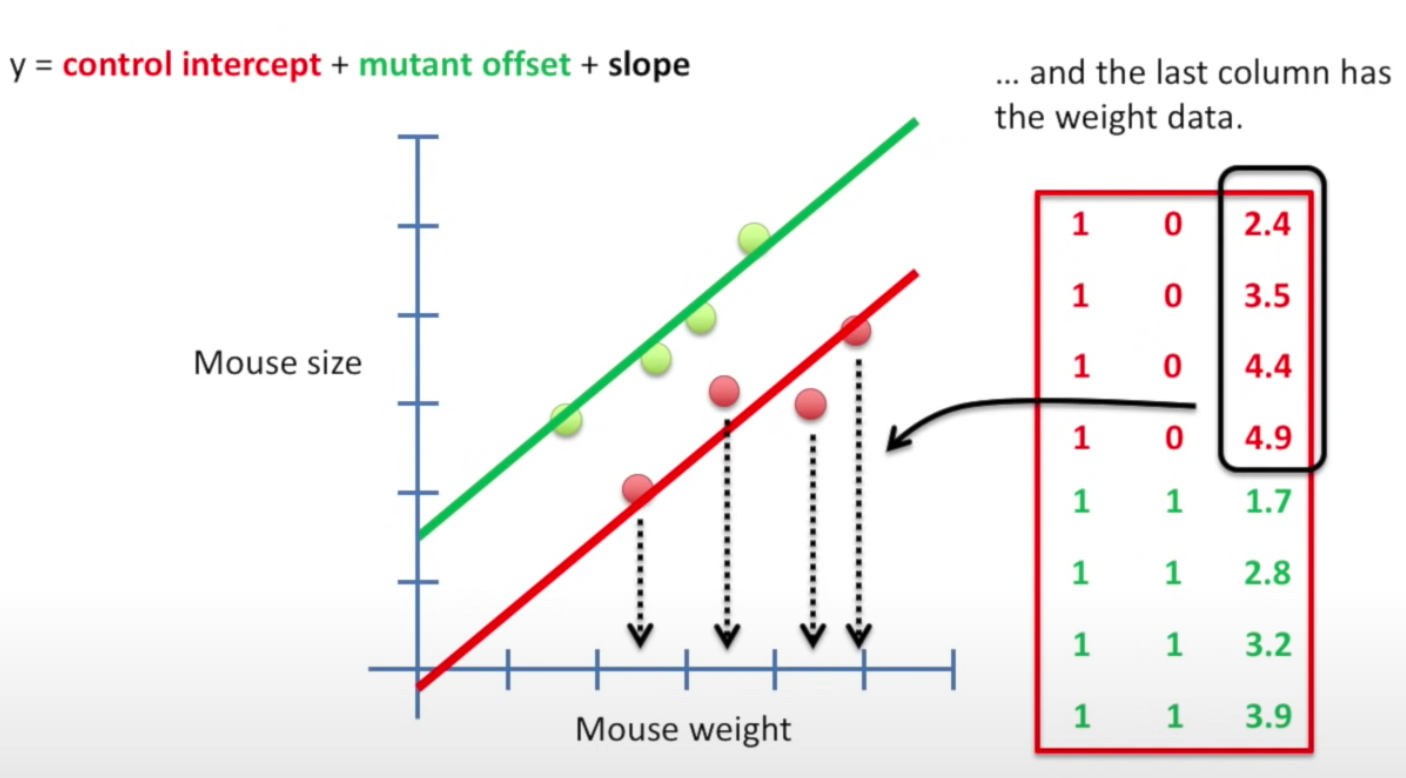
Therefore, when looking at rowwise as below chart, the first four rows represent the intercept points at the control group line (red), while the last four rows represent the intercept points at the mutant group line (green).
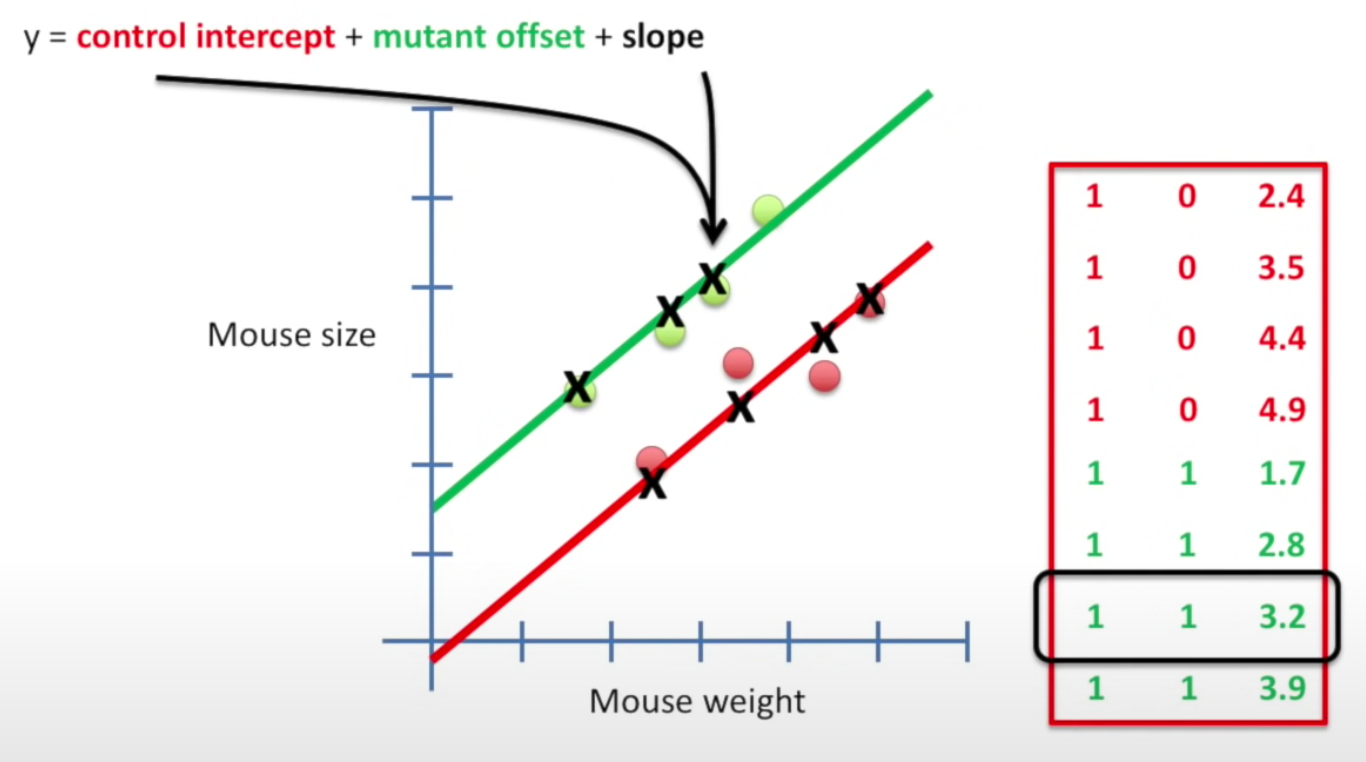
Compare simple model and fancy model
Once we have the locations of these dots, we can calculate the SS and then calculate the F-value.
Where P\text{fancy} = 3, P\text{simple} = 1
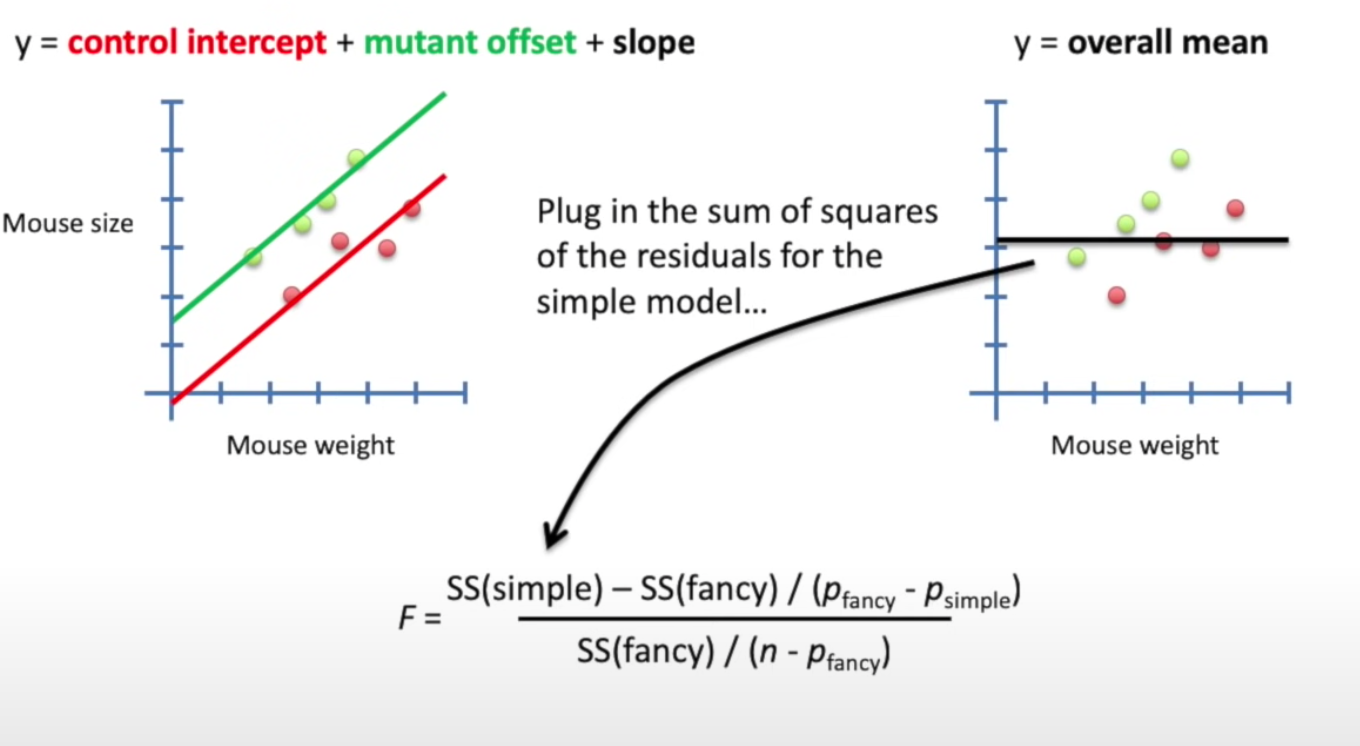
Based on the F-value, it can be converted to P-value, which is 0.003 in this case, less than 0.05, meaning the fancy model is significantly better than the simple model, or: taking weight and mouse type into consideration is significantly better at predicting size than just using the average size.
Note: the simple model can be something else e.g. a linear regression model between weight and size, or a t-test comparing two groups. The result would be different but p-value is still small.