Link: Statistical power Population and estimated parameters
Instead of P-hacking by adding more data points after the result, we can do Power analysis to determine the sample size of experiements.
What is Power analysis?
A power analysis determines what the sample size should be to ensure we have a good amount of Statistical power.
Two main factors of power
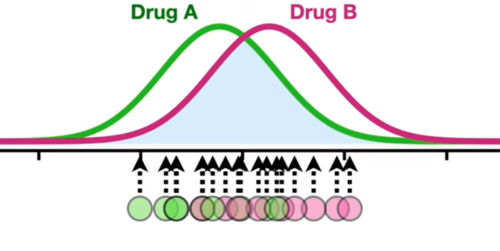
- How much overlap between the two distributions
- The sample size (the number of measurements)
Example: when there’re lots of overlap, we need more measurements in order to correctly reject the null hypothesis.
Why the power analysis would work
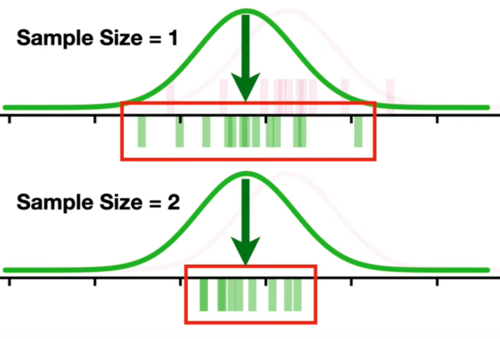
Sample 1: 1 measurement = 1 estimated mean Sample 2: 2 measurements = 1 estimated mean (the avg of two)
The intuition of power analysis
If we only pick 1 measurement, it may come from the tails of distribution (but we don’t know) which can easily disrupt the total sample.
However, if we pick 2 measurements and get the average as the estimates, the chances that both come from tails are pretty low. Therefore, we can get a more accurate result. AKA, extreme measurements have less effect on the estimates.
How to do power analysis
Decide how much power we want
Common threshold: 0.8
Determine the threshold for significance
The significance is often called , usually 0.05
Estimate the overlap between distributions
The overlap is determined by:
- The distance between distributions
- Standard deviation
Effective size is a created formula to reflect the overlap.
One of the simplest way to get pooled estimated standard deviation is:
Google “statistics power calculator”
Input:
- Power = ?
- Threshold of significance = ?
- Effective size = ?
Output: sample size = ?