Link: Supervised learning
The main idea of linear regression
- Use Least squares to Fitting a line to data in linear regression
- Calculated R-squared
- Calcualte a P-value for
Terminology
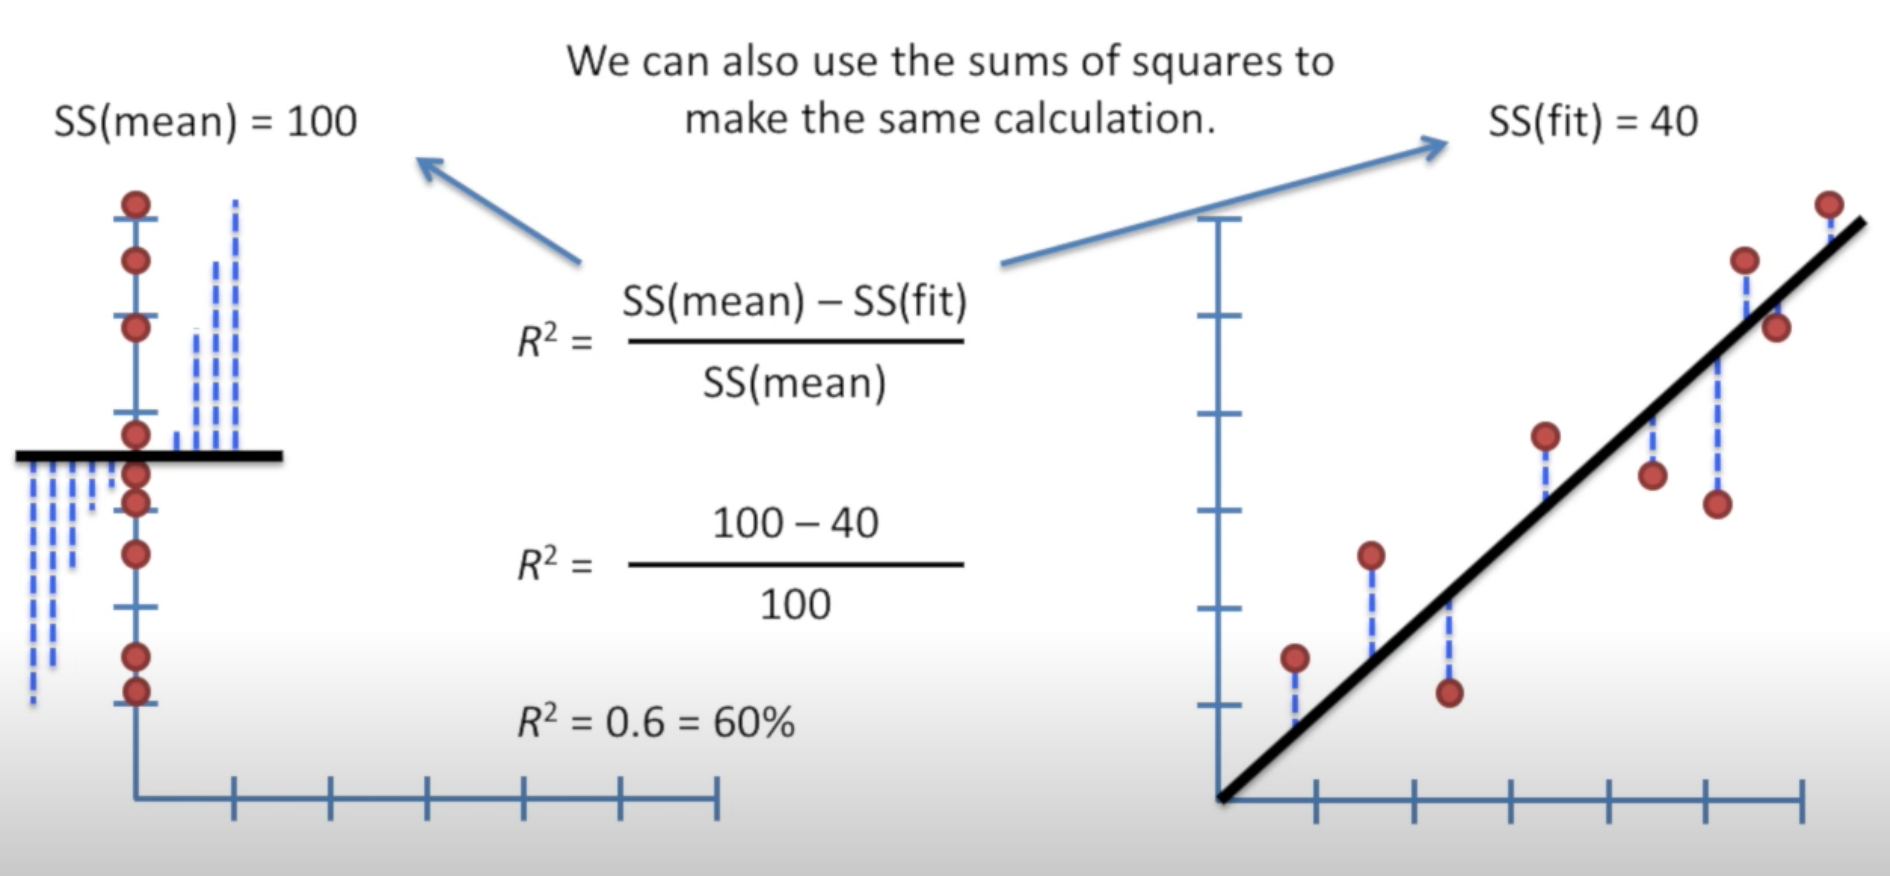
SS(mean) sum of squares around the mean
Var(mean) variation around the mean
In this way, var() can be viewed as the average SS.
SS(fit) sum of squares of around the least-squares fit
Var(fit) variation around the line
How does it work
-
Meausre
-
Measure
-
Plug in and we get
Note that when is 0, then = 1
-
Use p-value to determine if is statistically significant When there’re only two data points for the line, = 0. So we need a p-value to identify things like this. P-value for comes from , the F-value.
F-value
The larger F-value is, it indicates y can explain more variation in x.
is also known as degree of freedom.
Steps to covert F-value to p-value:
-
Generate a set of random data
-
Calculate the mean and ss(mean)
-
Plug-in and get value, plot the value in histogram
-
Repeat many times for random datasets
-
Do the same for the original dataset, and get . p-value = the number of more extreme values than divided by all F values
F-distributions
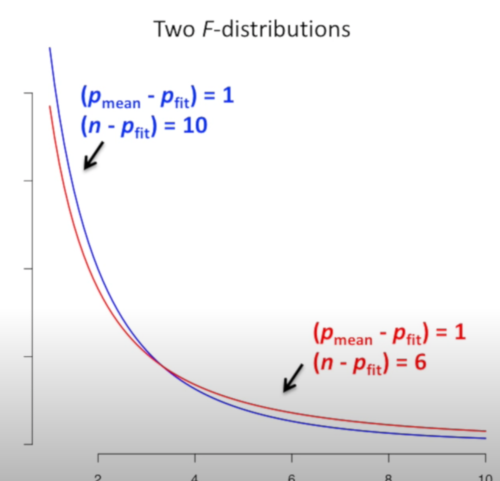
In above example, the sample of red is smaller than blue while other parameters are the same. The blue line is steeper, and thus, when we calculate the probability of the extreme values for getting p-value, the p-value would be smaller. Therefore, more sample size leads to a smaller p-value.